News Releases
Mistango updates on Manibridge’s Drill Intersections including 1.13% Nickel Equivalent over 36.55 metres
Highlights on the Manibridge Include:
- MNB040A: 36.55 metres of 1.13% NiEq, including 19.45 m of 1.69% NiEq
- MNB039: 36.2 metres of 0.69% NiEq including 12.15 m of 1.14% NiEq
- New high-grade nickel zone demonstrates the discovery potential for multiple high-grade nickel shoots within the broader mineralized shell at Manibridge.
Toronto, Ontario – March 17, 2023 – Mistango River Resources Inc. (the "Company" or "Mistango") (MIS: CSE) is pleased to update on Metal Energy’s progress on the Manibridge Mine. Mistango owns 15% of Manibridge, and Metal Energy owns 85%.
The Drill highlights above include the final drill hole assays of Metal Energy’s Phase Two drill program (Full results in Table 1, Figures 1 & 2 below) on the high-grade nickel and copper cobalt Manibridge project (the "Project" or "Manibridge") in the Thompson Nickel Belt, Manitoba.
"This new zone of over 1% nickel mineralization in the Upper Lens demonstrates discovery potential for multiple high-grade nickel shoots within the overall mineralized shell at Manibridge. Manibrdige’s mineralized shell is over 1 km of strike, traced down to 800 m depth, and locally exceeds 90 m thickness. Drill holes MNB036, MNB037 and MNB040A show the growth of this new nickel mineralized zone that currently measures 25 m thick by 40 m down-dip. This new zone contains our highest-grade continuous nickel intersection (19.45 m of 1.69% NiEq). We have maintained a 100% Ni-sulphide intersection success rate, and 34 of 36 drill holes have intersected over 1% nickel over variable sample widths. These facts demonstrate the robust nature of the Manibridge nickel system. Overall, we’re thrilled with the results from 2022’s drill programs, and we look to expand and discover additional high-grade nickel mineralization in 2023," said James Sykes, CEO of Metal Energy and operator of the Project.
Table 1 - Drill hole composite assay results from Sections 3N & 4N – Manibridge Project
|
DDH |
Composite Width (m) |
Ni% |
Cu% |
Co% |
NiEq% |
GT (NiEq% x m) |
|
MNB036 (4N) |
|
|||||
|
Upper Lens |
34.25 |
0.53 |
0.02 |
0.01 |
0.55 |
18.8 |
|
Lower Lens |
27.9 |
0.49 |
0.02 |
0.01 |
0.51 |
14.2 |
|
MNB037 (4N) |
|
|||||
|
Upper Lens |
4.5 |
1.35 |
0.04 |
0.02 |
1.4 |
6.3 |
|
Lower Lens |
27.15 |
0.45 |
0.01 |
0.01 |
0.47 |
12.8 |
|
MNB038 (4N) |
|
|||||
|
Upper Lens |
2.7 |
0.47 |
0.02 |
0.01 |
0.49 |
1.3 |
|
Lower Lens |
41.65 |
0.52 |
0.02 |
0.01 |
0.55 |
22.9 |
|
MNB039 (4N) |
|
|||||
|
Upper Lens |
4.25 |
0.53 |
0.02 |
0.02 |
0.56 |
2.4 |
|
Lower Lens |
36.2 |
0.69 |
0.03 |
0.02 |
0.73 |
26.4 |
|
MNB040A (3N) |
|
|||||
|
Upper Lens |
36.55 |
1.09 |
0.04 |
0.02 |
1.13 |
41.3 |
|
Lower Lens |
17.65 |
0.41 |
0.01 |
0.01 |
0.44 |
7.8 |
|
NOTES: |
||||||
|
1. See Table 3 for individual results used to compile these composite results |
||||||
Figure 1 – Cross-section of results for Section 4N (MNB036 to MNB039)
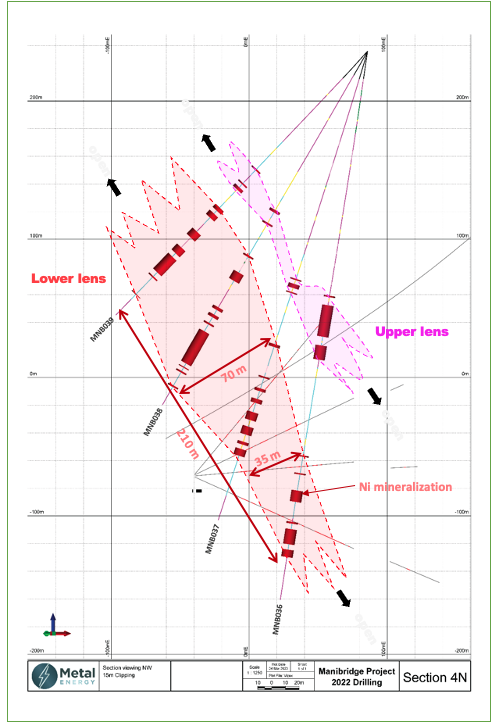
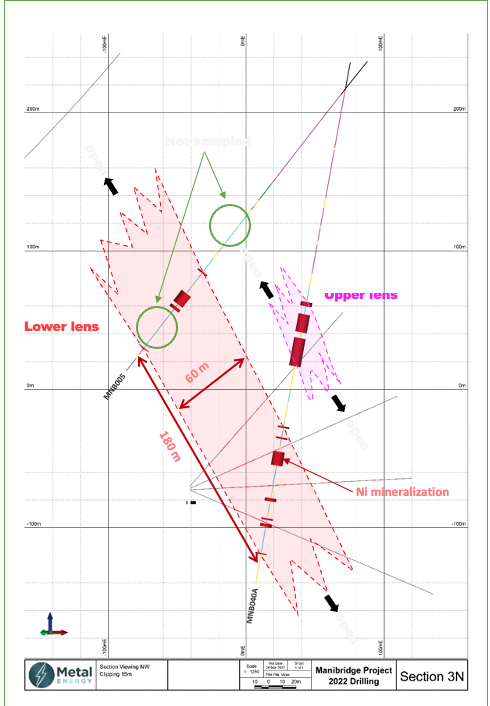
Figure 2 – Cross-section of results for Section 3N (MNB040A)
Manibridge Phase 2 Drill Program Results
A total of 10,091 metres were completed over 36 diamond drill holes, including 6 abandoned drill holes, with all completed drill holes intersecting visible nickel sulphides. The drill hole collar locations were all within 150 to 600 metres of the old mine workings. The drill holes targeted the shallower parts of the Manibridge nickel sulphide system at depths between 100 and 400 metres from surface.
Table 3 provides the individual and composite assay results and Table 4 provides the collar details for drill holes MNB036 to MNB040A.
Geochemical Sampling Procedures
Drill core samples were shipped to the Saskatchewan Research Council Geoanalytical Laboratories (SRC) in Saskatoon, Saskatchewan, in secure containment for preparation, processing, and whole rock and multi-element analysis by ICP-MS2 using total 4-acid digestion (HF:NHO3:HCl:HClO4). Assay samples comprise 0.2 to 1.5 m continuous samples of cut-core samples over nickel-sulphide mineralized intervals determined with a handheld XRF. Point samples comprise an isolated 0.1 to 0.5 m sample to characterize the rock types, alteration, structure, and potential for mineralization. The SRC is an ISO/IEC 17025/2005 and Standards Council of Canada certified analytical laboratory. Blanks, standard reference materials, and quartered core repeats were inserted into the sample stream at regular intervals by Metal Energy and the SRC in accordance with Metal Energy's quality assurance and quality control (QA/QC) procedures. Geochemical assay data are subject to verification procedures by qualified persons employed by Metal Energy prior to disclosure.
All reported depths and intervals are drill hole depths and intervals, unless otherwise noted, and do not represent true thicknesses, which have yet to be determined.
For the latest videos from Mistango, Metal Energy, and the rest of the Ore Group, subscribe to our YouTube Chanel: youtube.com/@theoregroup
Table 2 - Selected Historic and Recent Individual Drill Intersections on Manibridge
|
Hole Number |
Location |
From (m) |
To (m) |
Interval (m) |
%Ni |
%Ni*m |
|
6-60 |
Underground |
33.83 |
75.59 |
41.76 |
1.8 |
75.02 |
|
W50-39 |
Mined |
98.45 |
163.98 |
65.53 |
1.1 |
72.14 |
|
W50-27 |
Mined |
185.93 |
210.01 |
24.08 |
2.93 |
70.61 |
|
W50-34 |
Mined |
86.26 |
110.64 |
24.38 |
1.88 |
45.76 |
|
W50-31 |
Mined |
244.75 |
261.52 |
16.77 |
2.67 |
44.84 |
|
W50-05 |
Mined |
311.51 |
336.8 |
25.29 |
1.57 |
39.64 |
|
MN08-01 |
Surface |
156.5 |
195.75 |
39.25 |
0.98 |
38.47 |
|
MNB035* |
Surface |
189.7 |
221 |
31.3 |
1.19 |
37.25 |
|
W50-28 |
Mined |
203.3 |
211.99 |
8.69 |
4.15 |
36.07 |
|
W50-09 |
Mined |
178.92 |
198.73 |
19.81 |
1.8 |
35.62 |
|
MNB040A* |
Surface |
202.55 |
223 |
20.45 |
1.62 |
33.13 |
|
W50-33 |
Mined |
274.93 |
289.56 |
14.63 |
2.15 |
31.5 |
|
MNB004* |
Surface |
150.45 |
183.4 |
32.95 |
0.88 |
29 |
|
W50-50 |
Surface |
184.4 |
196.6 |
12.2 |
1.24 |
15.13 |
Notes to Table 2:
Cut-off grade = 0.3% Ni
Maximum consecutive internal dilution = 3.0 m downhole
Historic drill holes have not been verified or confirmed with twinned drill holes
Metal Energy considers "high-grade" to be nickel mineralization with a concentration greater than 0.8% Ni.
All reported depths and intervals are drill hole depths and intervals, unless otherwise noted, and do not represent true thicknesses, which have yet to be determined.
"*" Drilled by Metal Energy in 2022
Table 3 – Individual interval and total drill hole composite assay results
|
DDH |
From |
To |
Interval |
Ni% |
Cu% |
Co% |
Ni eq.% |
GT (Ni eq%*m) |
|
MNB036 |
179 |
180 |
1 |
0.34 |
0 |
0 |
0.34 |
0.34 |
|
|
186 |
209 |
23 |
0.58 |
0.02 |
0.01 |
0.6 |
13.8 |
|
|
215.5 |
225.75 |
10.25 |
0.45 |
0.01 |
0.01 |
0.47 |
4.82 |
|
includes |
224.5 |
225.75 |
1.25 |
1.35 |
0.06 |
0.02 |
1.39 |
1.74 |
|
|
296 |
297 |
1 |
0.39 |
0.02 |
0.01 |
0.41 |
0.41 |
|
|
309 |
310 |
1 |
0.36 |
0.01 |
0.01 |
0.38 |
0.38 |
|
|
321.75 |
330 |
8.25 |
0.32 |
0 |
0.01 |
0.33 |
2.72 |
|
|
344.7 |
346 |
1.3 |
0.38 |
0 |
0 |
0.39 |
0.51 |
|
|
350 |
361 |
11 |
0.73 |
0.04 |
0.01 |
0.76 |
8.36 |
|
includes |
351.5 |
352.5 |
1 |
1.31 |
0.09 |
0.02 |
1.37 |
1.37 |
|
and includes |
358.5 |
359 |
0.5 |
1.78 |
0.09 |
0.03 |
1.85 |
0.93 |
|
|
365 |
370.35 |
5.35 |
0.32 |
0.01 |
0.01 |
0.34 |
1.82 |
|
Composite Summary |
|
|
62.15 |
0.51 |
0.02 |
0.01 |
0.53 |
33.16 |
|
MNB037 |
172.75 |
173.6 |
0.85 |
0.33 |
0.01 |
0.02 |
0.36 |
0.31 |
|
|
176.65 |
179.55 |
2.9 |
1.57 |
0.04 |
0.02 |
1.61 |
4.67 |
|
|
182.75 |
183.5 |
0.75 |
1.71 |
0.08 |
0.02 |
1.77 |
1.33 |
|
|
222.45 |
224.45 |
2 |
0.34 |
0.02 |
0.01 |
0.37 |
0.74 |
|
|
247 |
248 |
1 |
0.4 |
0.01 |
0.01 |
0.42 |
0.42 |
|
|
256 |
258 |
2 |
0.32 |
0.01 |
0.01 |
0.34 |
0.68 |
|
|
264 |
267 |
3 |
0.39 |
0.03 |
0.01 |
0.42 |
1.26 |
|
|
274 |
280 |
6 |
0.55 |
0.02 |
0.01 |
0.57 |
3.42 |
|
includes |
279 |
280 |
1 |
1.4 |
0.1 |
0.02 |
1.46 |
1.46 |
|
|
285 |
291 |
6 |
0.33 |
0 |
0.01 |
0.34 |
2.04 |
|
|
296.45 |
298.55 |
2.1 |
0.49 |
0.02 |
0.01 |
0.51 |
1.07 |
|
|
301.95 |
307 |
5.05 |
0.62 |
0.01 |
0.01 |
0.64 |
3.23 |
|
includes |
301.95 |
303 |
1.05 |
1.04 |
0.02 |
0.02 |
1.07 |
1.12 |
|
Composite Summary |
|
|
31.65 |
0.58 |
0.02 |
0.01 |
0.61 |
19.17 |
|
MNB038 |
133.3 |
135 |
1.7 |
0.48 |
0 |
0.01 |
0.5 |
0.85 |
|
|
144 |
145 |
1 |
0.46 |
0.04 |
0.01 |
0.48 |
0.48 |
|
|
171.4 |
172.4 |
1 |
0.39 |
0 |
0.01 |
0.41 |
0.41 |
|
|
185.7 |
192.4 |
6.7 |
0.36 |
0.02 |
0.01 |
0.39 |
2.61 |
|
|
214.9 |
216.9 |
2 |
0.38 |
0 |
0.01 |
0.4 |
0.8 |
|
|
221 |
223 |
2 |
0.66 |
0.03 |
0.01 |
0.69 |
1.38 |
|
|
228 |
229 |
1 |
0.41 |
0 |
0.01 |
0.42 |
0.42 |
|
|
235 |
261.5 |
26.5 |
0.59 |
0.01 |
0.01 |
0.61 |
16.17 |
|
includes |
256.5 |
258.5 |
2 |
1.28 |
0.04 |
0.02 |
1.32 |
2.64 |
|
and includes |
261 |
261.5 |
0.5 |
2.13 |
0.03 |
0.03 |
2.18 |
1.09 |
|
|
264.5 |
265 |
0.5 |
0.3 |
0 |
0.01 |
0.33 |
0.17 |
|
|
268 |
269 |
1 |
0.34 |
0 |
0.01 |
0.36 |
0.36 |
|
|
280 |
281 |
1 |
0.31 |
0.13 |
0.02 |
0.37 |
0.37 |
|
Composite Summary |
|
|
44.4 |
0.52 |
0.01 |
0.01 |
0.54 |
24.01 |
|
MNB039 |
117.5 |
118.5 |
1 |
0.57 |
0 |
0.02 |
0.59 |
0.59 |
|
|
131.5 |
132.5 |
1 |
0.46 |
0.03 |
0.01 |
0.49 |
0.49 |
|
|
135.5 |
137.75 |
2.25 |
0.54 |
0.02 |
0.02 |
0.57 |
1.28 |
|
|
156 |
159 |
3 |
0.4 |
0.01 |
0.02 |
0.44 |
1.32 |
|
includes |
156 |
156.35 |
0.35 |
1.37 |
0 |
0.08 |
1.49 |
0.52 |
|
|
162 |
166 |
4 |
0.38 |
0.03 |
0.01 |
0.41 |
1.64 |
|
|
180 |
186.1 |
6.1 |
0.99 |
0.04 |
0.02 |
1.03 |
6.28 |
|
includes |
181 |
186.1 |
5.1 |
1.06 |
0.04 |
0.02 |
1.1 |
5.61 |
|
|
196 |
201.9 |
5.9 |
0.55 |
0.03 |
0.01 |
0.57 |
3.36 |
|
includes |
197 |
198 |
1 |
1.14 |
0.09 |
0.02 |
1.19 |
1.19 |
|
|
205.3 |
221 |
15.7 |
0.8 |
0.02 |
0.02 |
0.83 |
13.03 |
|
includes |
207.3 |
212 |
4.7 |
1.11 |
0.03 |
0.02 |
1.15 |
5.4 |
|
and includes |
219 |
220 |
1 |
1.03 |
0.03 |
0.02 |
1.07 |
1.07 |
|
|
225 |
226 |
1 |
0.38 |
0.01 |
0.02 |
0.4 |
0.4 |
|
|
242.9 |
243.4 |
0.5 |
0.42 |
0.16 |
0.04 |
0.52 |
0.26 |
|
Composite Summary |
|
|
40.45 |
0.68 |
0.03 |
0.02 |
0.71 |
28.66 |
|
MNB040A |
176 |
179 |
3 |
0.33 |
0.01 |
0.01 |
0.35 |
1.05 |
|
|
185 |
198.1 |
13.1 |
0.52 |
0.03 |
0.02 |
0.55 |
7.21 |
|
|
202.55 |
223 |
20.45 |
1.57 |
0.06 |
0.02 |
1.62 |
33.13 |
|
includes |
202.55 |
222 |
19.45 |
1.63 |
0.06 |
0.02 |
1.69 |
32.87 |
|
|
267.5 |
268.5 |
1 |
0.44 |
0 |
0.03 |
0.49 |
0.49 |
|
|
275.5 |
276.5 |
1 |
0.35 |
0 |
0.02 |
0.37 |
0.37 |
|
|
286 |
296 |
10 |
0.35 |
0 |
0.01 |
0.37 |
3.7 |
|
|
320.2 |
322.35 |
2.15 |
0.4 |
0 |
0.01 |
0.41 |
0.88 |
|
|
335 |
336 |
1 |
1.09 |
0.05 |
0.02 |
1.13 |
1.13 |
|
|
339 |
341 |
2 |
0.43 |
0.02 |
0.01 |
0.44 |
0.88 |
|
|
360.5 |
361 |
0.5 |
0.35 |
0.15 |
0.02 |
0.43 |
0.22 |
|
Composite Summary |
|
|
54.2 |
0.87 |
0.03 |
0.02 |
0.9 |
49.05 |
|
NOTES: |
||||||||
Table 4 – Drill hole collar details
|
DDH |
Target Area |
Section |
East |
North |
Elevation |
Azimuth |
Dip |
EOH |
|
MNB036 |
Manibridge Mine |
4 North |
510,738 |
6,062,122 |
236 |
300 |
-82 |
401.75 |
|
MNB037 |
Manibridge Mine |
4 North |
510,738 |
6,062,122 |
236 |
300 |
-73 |
356 |
|
MNB038 |
Manibridge Mine |
4 North |
510,738 |
6,062,122 |
236 |
300 |
-60 |
296 |
|
MNB039 |
Manibridge Mine |
4 North |
510,738 |
6,062,122 |
236 |
300 |
-47 |
264.15 |
|
MNB040A |
Manibridge Mine |
3 North |
510,713 |
6,062,093 |
236 |
300 |
-80 |
283 |
|
5 DDH |
|
|
|
1,700.90 |
||||
|
NOTES: East and North units are metres using NAD83 datum, UTM Zone 14N |
||||||||
QP Statement
The technical information contained in this news release has been reviewed and approved by Mike Sweeny, P.Geo., Vice-President, Exploration & Development for Metal Energy, and a Qualified Person as defined in "National Instrument 43-101, Standards of Disclosure for Mineral Projects."
For further information, please contact:
Mistango River Resources
MIS on the CSE
Stephen Stewart, Chairman
416.644.1567
Reader Advisory
Certain information set forth in this news release contains forward-looking statements or information ("forward-looking statements"), including details about the business of the Company. By their nature, forward-looking statements are subject to numerous risks and uncertainties, some of which are beyond the Company's control, including the impact of general economic conditions, industry conditions, volatility of commodity prices, currency fluctuations, environmental risks, operational risks, competition from other industry participants, stock market volatility. Although the Company believes that the expectations in its forward-looking statements are reasonable, its forward-looking statements have been based on factors and assumptions concerning future events which may prove to be inaccurate. Those factors and assumptions are based upon currently available information. Such statements are subject to known and unknown risks, uncertainties and other factors that could influence actual results or events and cause actual results or events to differ materially from those stated, anticipated or implied in the forward-looking statements. Accordingly, readers are cautioned not to place undue reliance on the forward-looking statements, as no assurance can be provided as to future results, levels of activity or achievements. Risks, uncertainties, material assumptions and other factors that could affect actual results are discussed in our public disclosure documents available at www.sedar.com including the Filing Statement dated November 15, 2021. Furthermore, the forward-looking statements contained in this document are made as of the date of this document and, except as required by applicable law, the Company does not undertake any obligation to publicly update or to revise any of the included forward-looking statements, whether as a result of new information, future events or otherwise. The forward-looking statements contained in this document are expressly qualified by this cautionary statement.
Neither the TSX Venture Exchange Inc. nor its Regulation Services Provider (as that term is defined in the policies of the TSX Venture Exchange) accepts responsibility for the adequacy or accuracy of this release